You've probably been in a situation where you needed to analyze a large amount of data and felt a little lost. Maybe you thought it was impossible or even extended the project deadline to get it done.
The good newsMicrosoft's Power BI creates comprehensive reports in just a few clicks (without writing any code).
In this content, we will show you how Power BI works, what a dashboard is and what are the advantages of using this system. Furthermore, we will show you step by step how to create your own visual panel. If you are curious and want to know more, continue reading!
Table of Contents
What is Power BI?

Power BI is a famous tool in the world of technology and you've probably already heard about it.
It's a platform no-code From Microsoft; drag, filter, publish... With this tool, you can create personalized and interactive reports, using a variety of data sources and visuals.
Within the Power BI system, there are features that allow you to explore, analyze and share data quickly and easily. It is made up of three main components:
Power BI Desktop
Power BI Desktop is a free desktop app that you can use to create and edit reports. It is an excellent tool for anyone who wants to work with data offline, locally or in the cloud.
Power BI Online
On the other hand, Power BI Online is a online service that you can access through your browser and use to publish, manage, and consume reports. This service is ideal for those who work collaboratively, as it allows instant sharing.
Power BI Mobile
Finally, there is Power BI Mobile, a app for cell phone or tablet which is used to view and interact with reports and dashboards. This way, you can access and view data from anywhere and at any time. It is a good option for those who value flexibility at work.
These three components of Power BI work in an integrated and synchronized way, allowing you to work flexibly and consistently.
What is a dashboard?
Imagine you have a technology startup and wants to know how your growth is going. You have a report with various data on your customers, products, total profit, etc. But how to connect all of this and be able to visualize it clearly?
That's where the creating a dashboard. The panel is like a summary of the report that will be generated by Power BI. It shows the most important information about your data in one place.
The dashboard will display only the most important and interesting information about the data, such as:
- Conversion rate;
- Monthly billing;
- Regions where customers are located.
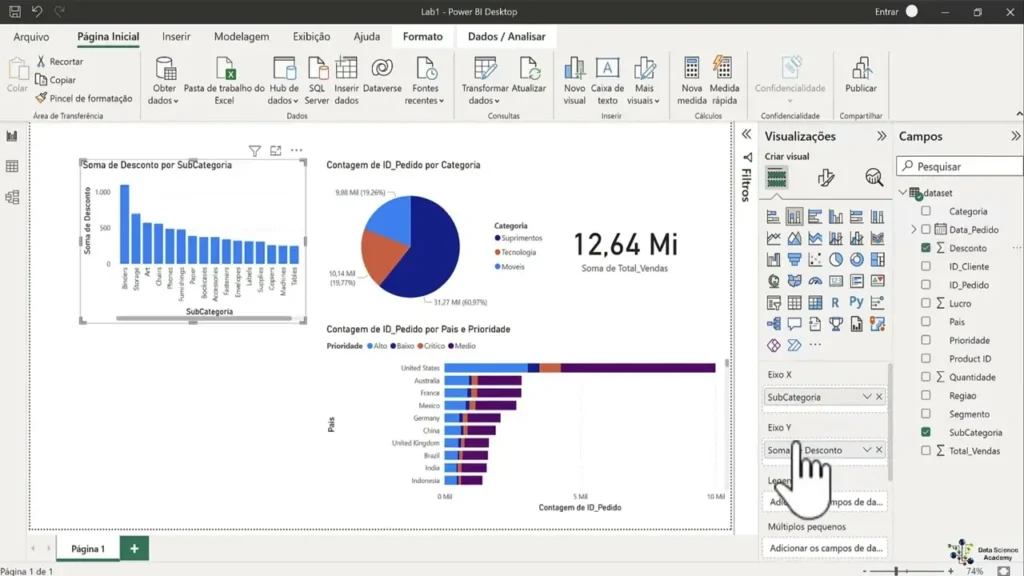
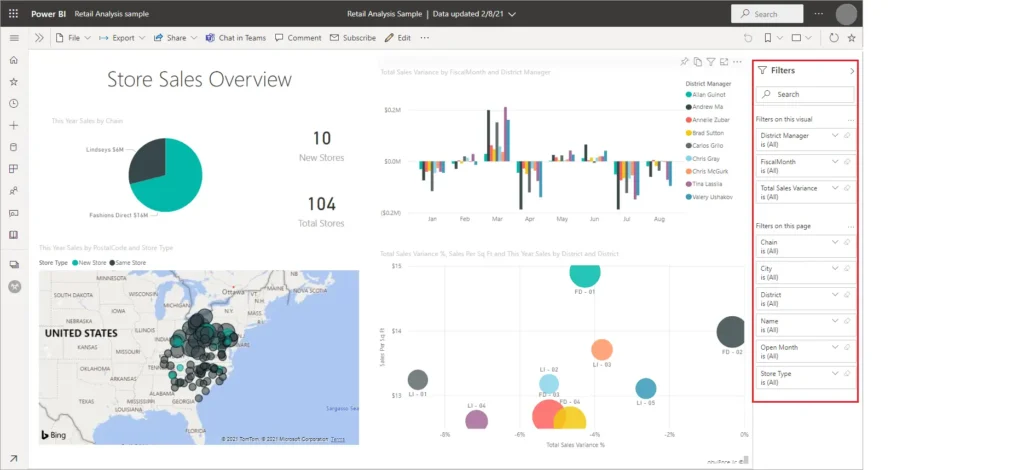
All this information is displayed visually, using graphs, tables, maps and other elements that help you see the data quickly and easily. See an example of a dashboard made in Power BI:
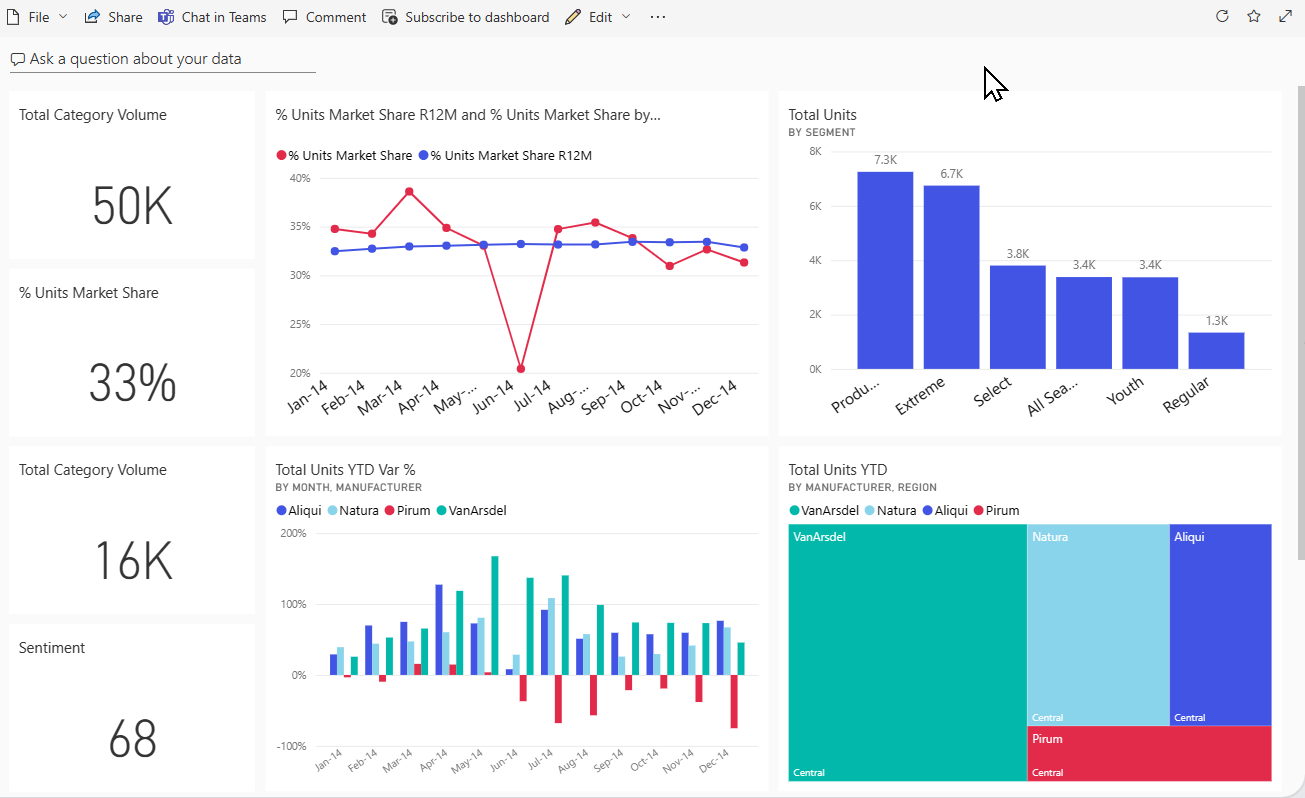
Image: Reproduction / Microsoft
Step by step to create a dashboard with Power BI without using code
Now that you understand what Power BI and a dashboard are, it's time to put it into practice. That's why, We have separated the step by step guide for you to create your own dashboard. Are you ready? Let's go!
Open Power BI
To get started, you need to open the platform in the desktop, online or mobile version. If you have never used it, You need to simply register with your corporate email.
Insert database
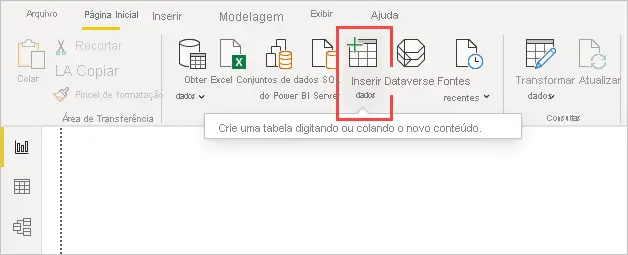
You can connect Power BI to various data sources, such as an Excel spreadsheet, for example. To insert the base, click Get data on the home tab and select the appropriate option.
Then navigate to the file you want to use and click Open. Choose the spreadsheets, files, or other data source you want to import and click To load.
Give a title
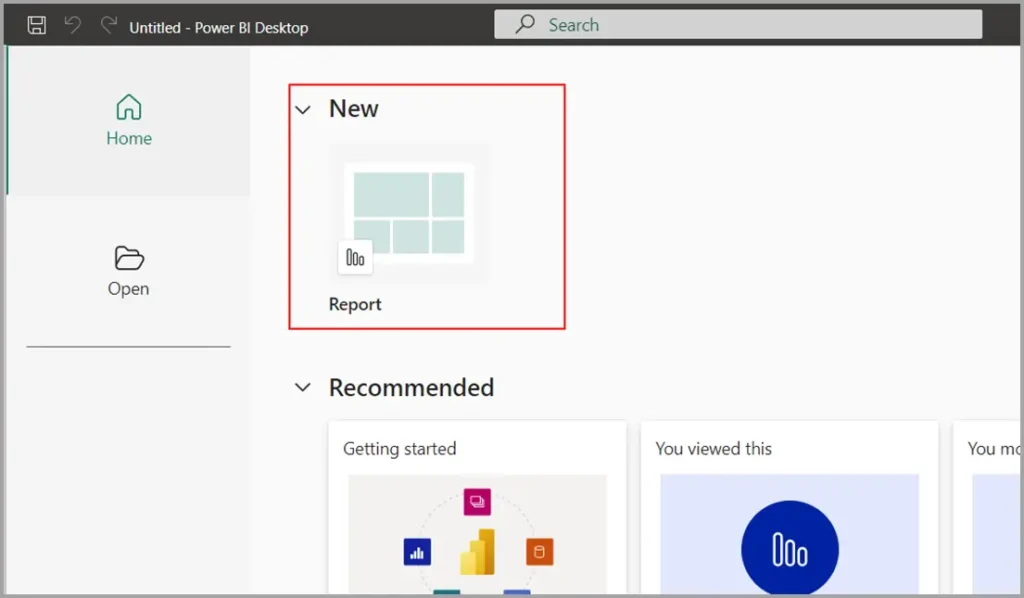
You can give your report a title to easily identify it. To do this, click Report in the tab Exhibition and type the title you want in the box File name.
Insert dashboard cards
Dashboard cards are visual elements that show a single value or measure, such as total sales. They are useful for highlighting the most important information in your report.
To insert dashboard cards, click Card in the tab Views and drag it to the report area. Then drag the field you want to show on the card to the area Value.
You can adjust the size, position and format of the card as you prefer and you can repeat this process to insert more dashboard cards with other measurements.
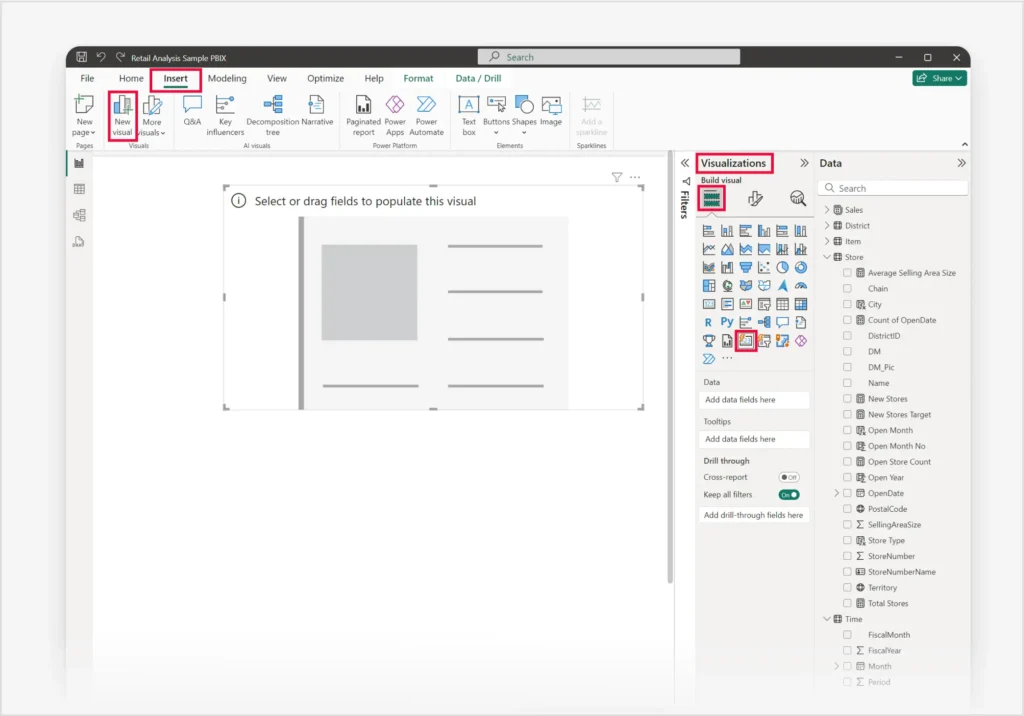
Time to put up the graphics
Charts are useful for exploring and analyzing data in a graphical and agile way. To insert, click the type of chart you want to use in the tab Views and drag it to the report area.
Then drag the fields you want to show on the chart to the corresponding areas. For example, you can drag the field Date to the area Axle and the field Profit to the area Values to create a line graph that shows the evolution of profit over time.
Use the dashboard filter
The dashboard filter is a feature that allows you to quickly and easily apply filters to your data. You can use the filter to change what is shown on your dashboard cards and charts, according to the criteria you choose.
To use the dashboard filter, click Dashboard filter in the tab Views and drag it to the report area. Then drag the field you want to use as a filter into the area Filters.
To apply a filter, just click on the value that you want to select in the dashboard filter. To clear it, click the value again or click Clear selection.
What are the advantages of using Power BI?
Using Power BI has many advantages, whether for large teams or even for solo work. See some advantages:
Easy deployment
Deploying Power BI is very simple, because it Does not require complex installation or advanced configuration. You can download the Desktop version for free from Microsoft's apps store or even use the online version.
Good accessibility
Furthermore, Power BI is a good accessibility tool. It allows you to access and view your data from anywhere, anytime. You can, for example, use Power BI Mobile to interact with your reports regardless of where you are.
Live data monitoring
Live data monitoring is another advantageous function included in Power BI. With him, You can track data without having to manually update your reports and dashboards. You can even connect it to sources that offer streaming data, such as:
- Azure Stream Analytics;
- Event Hubs;
- IoT Hub.
Constant updates
The tool is also always evolving and improving, thanks to user feedback and market news. Power BI Desktop, for example, always brings new features, improvements and fixes with each update.
Has user communities
Whenever we start learning a new tool, we look for a community that can help us in the learning process. And with Power BI this is very easy, since it has a active and engaged community of users, who share tips, questions, ideas and solutions.
Integrate Power BI into your no code app
Now that you understand what Power BI is and how it can help you visualize your data faster, let's talk a little about its integration with a no code app.
If you already follow us, you know everything about FlutterFlow. But let's explain it to you once again.
FlutterFlow is a platform that allows you to create apps for iOS and Android through an intuitive interface and ready-to-use components. It is one of the best no-code tools available on the market today!
But what does FlutterFlow have to do with Power BI? The answer is: everything! You can integrate FlutterFlow with Power BI and create interactive dashboards in your application using no-code integration services.
Imagine being able to create a personal financial control app that connects Power BI directly with your bank. He could create a report and a dashboard that shows his income, expenses and investments in a simple and visual way.
And this is just one of the many integration possibilities that can be made between Power BI and other no-code platforms!
Discover No-Code Start-Up!
Programming with no-code platforms is the future and we want to help you become the best professional on the market.
With the right knowledge, you can boost your career and start making money today.
Take a FlutterFlow course for free and start your journey!
Is there a free version of Power BI?
Yes. Power BI Desktop and the "Free" license for the service allow you to import data, create reports and dashboards, and use them in your personal portal without paying anything.
The limitation lies in collaboration: those using the free plan cannot share content or publish to team workspaces; these features require Pro, PPU, or Premium plans.
What is the difference between the free and paid versions of Power BI?
The free plan is designed for individual use: 1 GB of storage per user, up to eight daily updates, and zero sharing.
O Power BI Pro (US$ 14 per user/month since Apr 2025) enables publishing to workspaces, apps and real-time collaboration, with 10 GB of space and 48 daily updates; while the Premium Per User (US$ 24) adds larger models, faster refresh rate, and AI features, while the Capacity Premium offers dedicated features for high volumes.
How much does a Power BI dashboard cost?
The cost includes licensing and development. For internal distribution, you will need at least [number] licenses. Pro (≈ R$ 70/month per user at the August/2025 exchange rate) or PPU If you want premium features; projects requiring dedicated capacity start at around US$4,995/month.
The cost to create a dashboard varies depending on the scope: standard dashboards, connected to already structured sources, usually start at... R$ 1.5 thousand – R$ 5 thousand; Corporate solutions with advanced modeling, line-level security, and load automation can overcome R$ 30 thousand, in addition to recurring licenses.